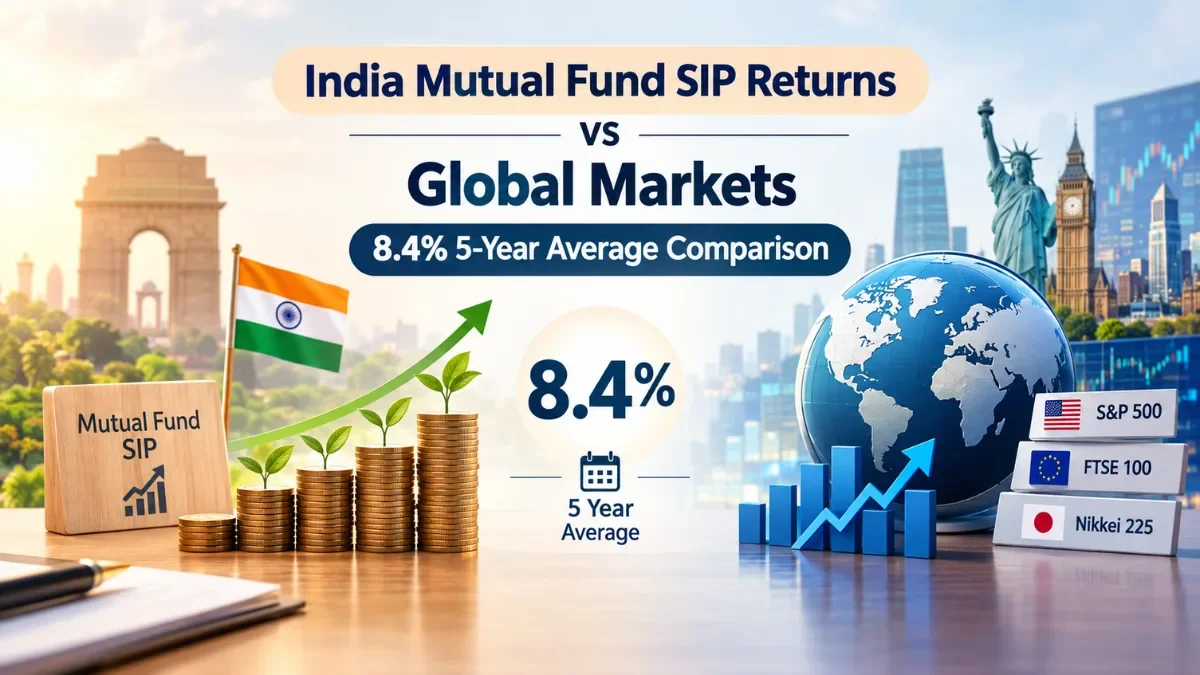
India's mutual fund Systematic Investment Plans (SIPs) delivered an average internal rate of return (XIRR) of 8.4% over rolling five-year periods, outperforming benchmark equity indices across most developed and emerging global markets. Driven by consistent domestic retail participation and robust underlying corporate earnings growth, Indian equity SIPs offered a highly resilient risk-adjusted performance profile compared to major international indices over the same timeframe.
Global Performance Comparison: 5-Year Rolling SIP Returns
To understand how Indian rupee dollar-cost averaging performs on the global stage, market analysts evaluate rolling five-year XIRR across prominent domestic and international equity benchmarks:
| Region / Index | Market Type | Average 5-Year Rolling SIP Return (XIRR) | Key Drivers & Characteristics |
| India (Nifty 50 / Broad Equity) | Emerging | 8.4% | Strong domestic retail SIP inflows, resilient corporate earnings growth, high long-term positive return probability. |
| United States (S&P 500) | Developed | 7.2% – 8.1% | Tech mega-cap dominance, dollar strength, but higher entry valuations in recent cycles. |
| United States (Nasdaq 100) | Developed | 8.5% – 9.2% | Concentrated exposure to global technology firms; higher return profile offset by sharper drawdowns. |
| Europe (STOXX Europe 600) | Developed | 4.8% – 5.5% | Modest economic growth, heavy tilt toward financial and industrial sectors, currency fluctuations. |
| Emerging Markets (MSCI EM Index) | Emerging | 3.9% – 4.8% | Dragged down by volatility in Chinese equities, geopolitical shifts, and currency depreciation against the USD. |
| Japan (Nikkei 225) | Developed | 6.1% – 6.8% | Corporate governance reforms and mild inflation recovery boosting long-term investor sentiment. |
Key Drivers Behind India's Strong 5-Year SIP Performance
1. The Rupee Cost Averaging Advantage
Systematic Investment Plans mitigate market timing risk by acquiring more mutual fund units when asset prices decline and fewer units when markets rally. Over rolling five-year periods, this automated discipline allows Indian investors to smooth out mid-cycle corrections—such as global interest rate hikes or supply chain disruptions—converting short-term market volatility into lower average unit acquisition costs.
2. Structurally Sustained Domestic Inflows
Unlike foreign portfolio investments (FPI), which fluctuate based on global macroeconomic triggers and currency dynamics, domestic SIP contributions in India provide a steady monthly liquidity cushion. This structural domestic bid absorbs foreign sell-offs during global pullbacks, reducing downside volatility for broader domestic indices like the Nifty 50 and BSE Sensex.
3. Emerging Market Growth Differential
India’s real gross domestic product (GDP) expansion rate continues to lead major global economies, translating directly into corporate revenue growth across banking, infrastructure, automotive, and technology services sectors. Consequently, domestic equity funds offer a higher underlying earnings yield compared to mature developed markets where growth rates have normalized to low single digits.
Historical Consistency: Positive Return Probabilities
Evaluating equity investments solely by absolute returns overlooks risk exposure. Rolling return analysis provides a more realistic measure of consistency by measuring every possible overlapping five-year period:
Consistency Rate: Historical rolling data shows that holding an equity SIP in India over a five-year horizon resulted in positive returns in over 98% of historical periods.
Downside Cushion: The disciplined nature of monthly tranche purchases significantly reduces the likelihood of capital destruction, even when an investor enters the market near cyclical valuation peaks.
Inflation-Adjusted Real Returns: With Indian retail inflation averaging around 5% to 6%, an 8.4% average SIP yield provides a positive real rate of return of approximately 2.4% to 3.4%, helping investors beat purchasing power erosion over medium-term horizons.
Tactical Takeaways for Global & Domestic Investors
Maintain Horizon Discipline: While 5-year rolling returns average 8.4%, extending SIP horizons to 7–10 years historically elevates average annual returns toward the 11%–14% bracket as market cycles fully complete.
Diversify Across Market Caps: Combining large-cap stability with targeted mid-cap or flexi-cap funds allows investors to capture India’s broader economic breadth while maintaining downside protection.
Account for Currency & Inflation: For international investors viewing Indian equities in USD terms, foreign exchange movements must be factored in; however, India's higher underlying nominal return differential helps offset currency depreciation over extended compounding cycles.
Also Read :- SIP vs RD: Which Is Better for Your Financial Goals in 2026?